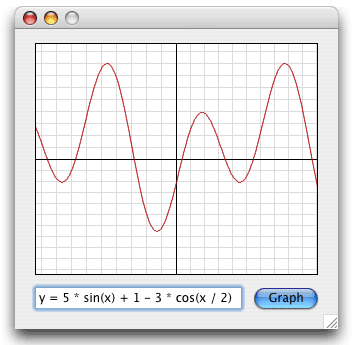
Graphing Calculator
Yes, we're going to write a simple 2d x/y graphing calculator! The coolest part is how little code it took to write. Guess how many lines it took to write this. 1000? 500? 500 sounds reasonable, right? I mean, it needs to draw the grid, the graph, and it needs to parse the equations, so 500 seems pretty good, right? Well, it only took 119. And that isn't even optimized, so it could easily take less. What allows us to do this black magic so easily and briefly? RbScript!
How It Works
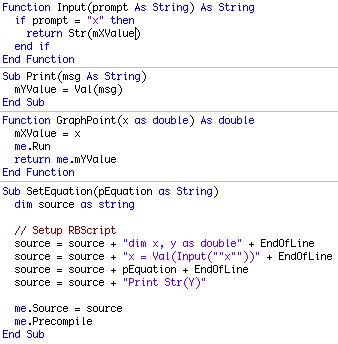
 At the core of this project are two classes. The GraphCanvas and the GraphRbScript. The equation in the field is sent to the GraphCanvas instance which then uses the GraphRbScript to evaluate the equation for every x value in the visible range of the canvas. The results are then plotted on the canvas by interpolating between the points with lines (which also gives us the nice antialiased line). That's all there is to it. RbScript's powerful nature by being able to parse and evaluate REALbasic code at runtime is the key to how this project works. Enter in any mathematical expression into the field using any of the math functions such as Pow, atan, etc, and it'll graph it!
GraphCanvas
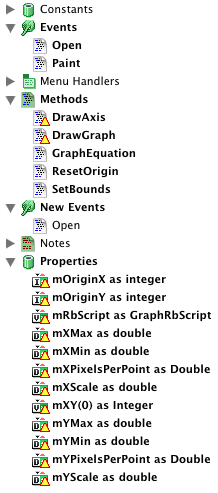
The GraphCanvas has oodles of properties as seen on the right, and also has a handful of methods. In the Open event the bounds (the visible area and scale [pixel to graph unit]) of the view is set and the canvas's GraphRbScript is created. The Paint event fills the background with white, draws the axis grid (DrawAxis), calls the DrawGraph method which loops through and graphs the result of the equation, and then draws the border of the canvas. Aside from the mXY(0) and mRbScript properties, everything else is used to detrmine how and where to plot the results. The mXY property is an array of resultant points to plot. The equation being drawn is set by GraphEquation which merely calls "mRbScript.SetEquation pEquation" (where pEquation is the parameter passed) and then refreshes the canvas. All of the real work takes place in the DrawGraph method and another 10 lines or so in the GraphRbScript class.
DrawGraph
The draw graph method is shown below, and should be commented well enough. The basic idea is that the first loop goes through every available X pixel in the canvas, converts it to to a graphing unit, finds the corresponding y value in graphing units, then converts it back to a pixel position. Then the latter loop interpolates between the points with a line. Pretty simple!
Protected Sub DrawGraph()
dim x, y as integer
dim xx, yy as double
dim i, c as integer
dim g as Graphics
// Setup
g = me.Graphics
Redim mXY(0)
// Find Graph Points
for x = 0 to me.Width - 1
// Obtains Graph Units for the Point that Should
// Be drawn at X pixels in the canvas.
xx = (x - mOriginX) * mXPixelsPerPoint
yy = mRbScript.GraphPoint(xx)
// Obtains the matching Y pixel position for the X
y = me.Height - (yy / mYPixelsPerPoint + mOriginY)
// Add To Draw Later
mXY.Append x
mXY.Append y
next
// Draw Interpolated Points
g.ForeColor = RGB(180, 0, 0)
c = UBound(mXY)
for i = 1 to c step 2
x = mXY(i)
y = mXY(i+1)
if i + 2 > c then exit
xx = mXY(i+2)
yy = mXY(i+3)
g.DrawLine x, y, xx, yy
next
End Sub
Finished
So there you have it. It's not a 3d graphing program, and probably not as powerful as a TI-83, but it's a good example and a good start for a simple graphing program. As always, you can download the project here.